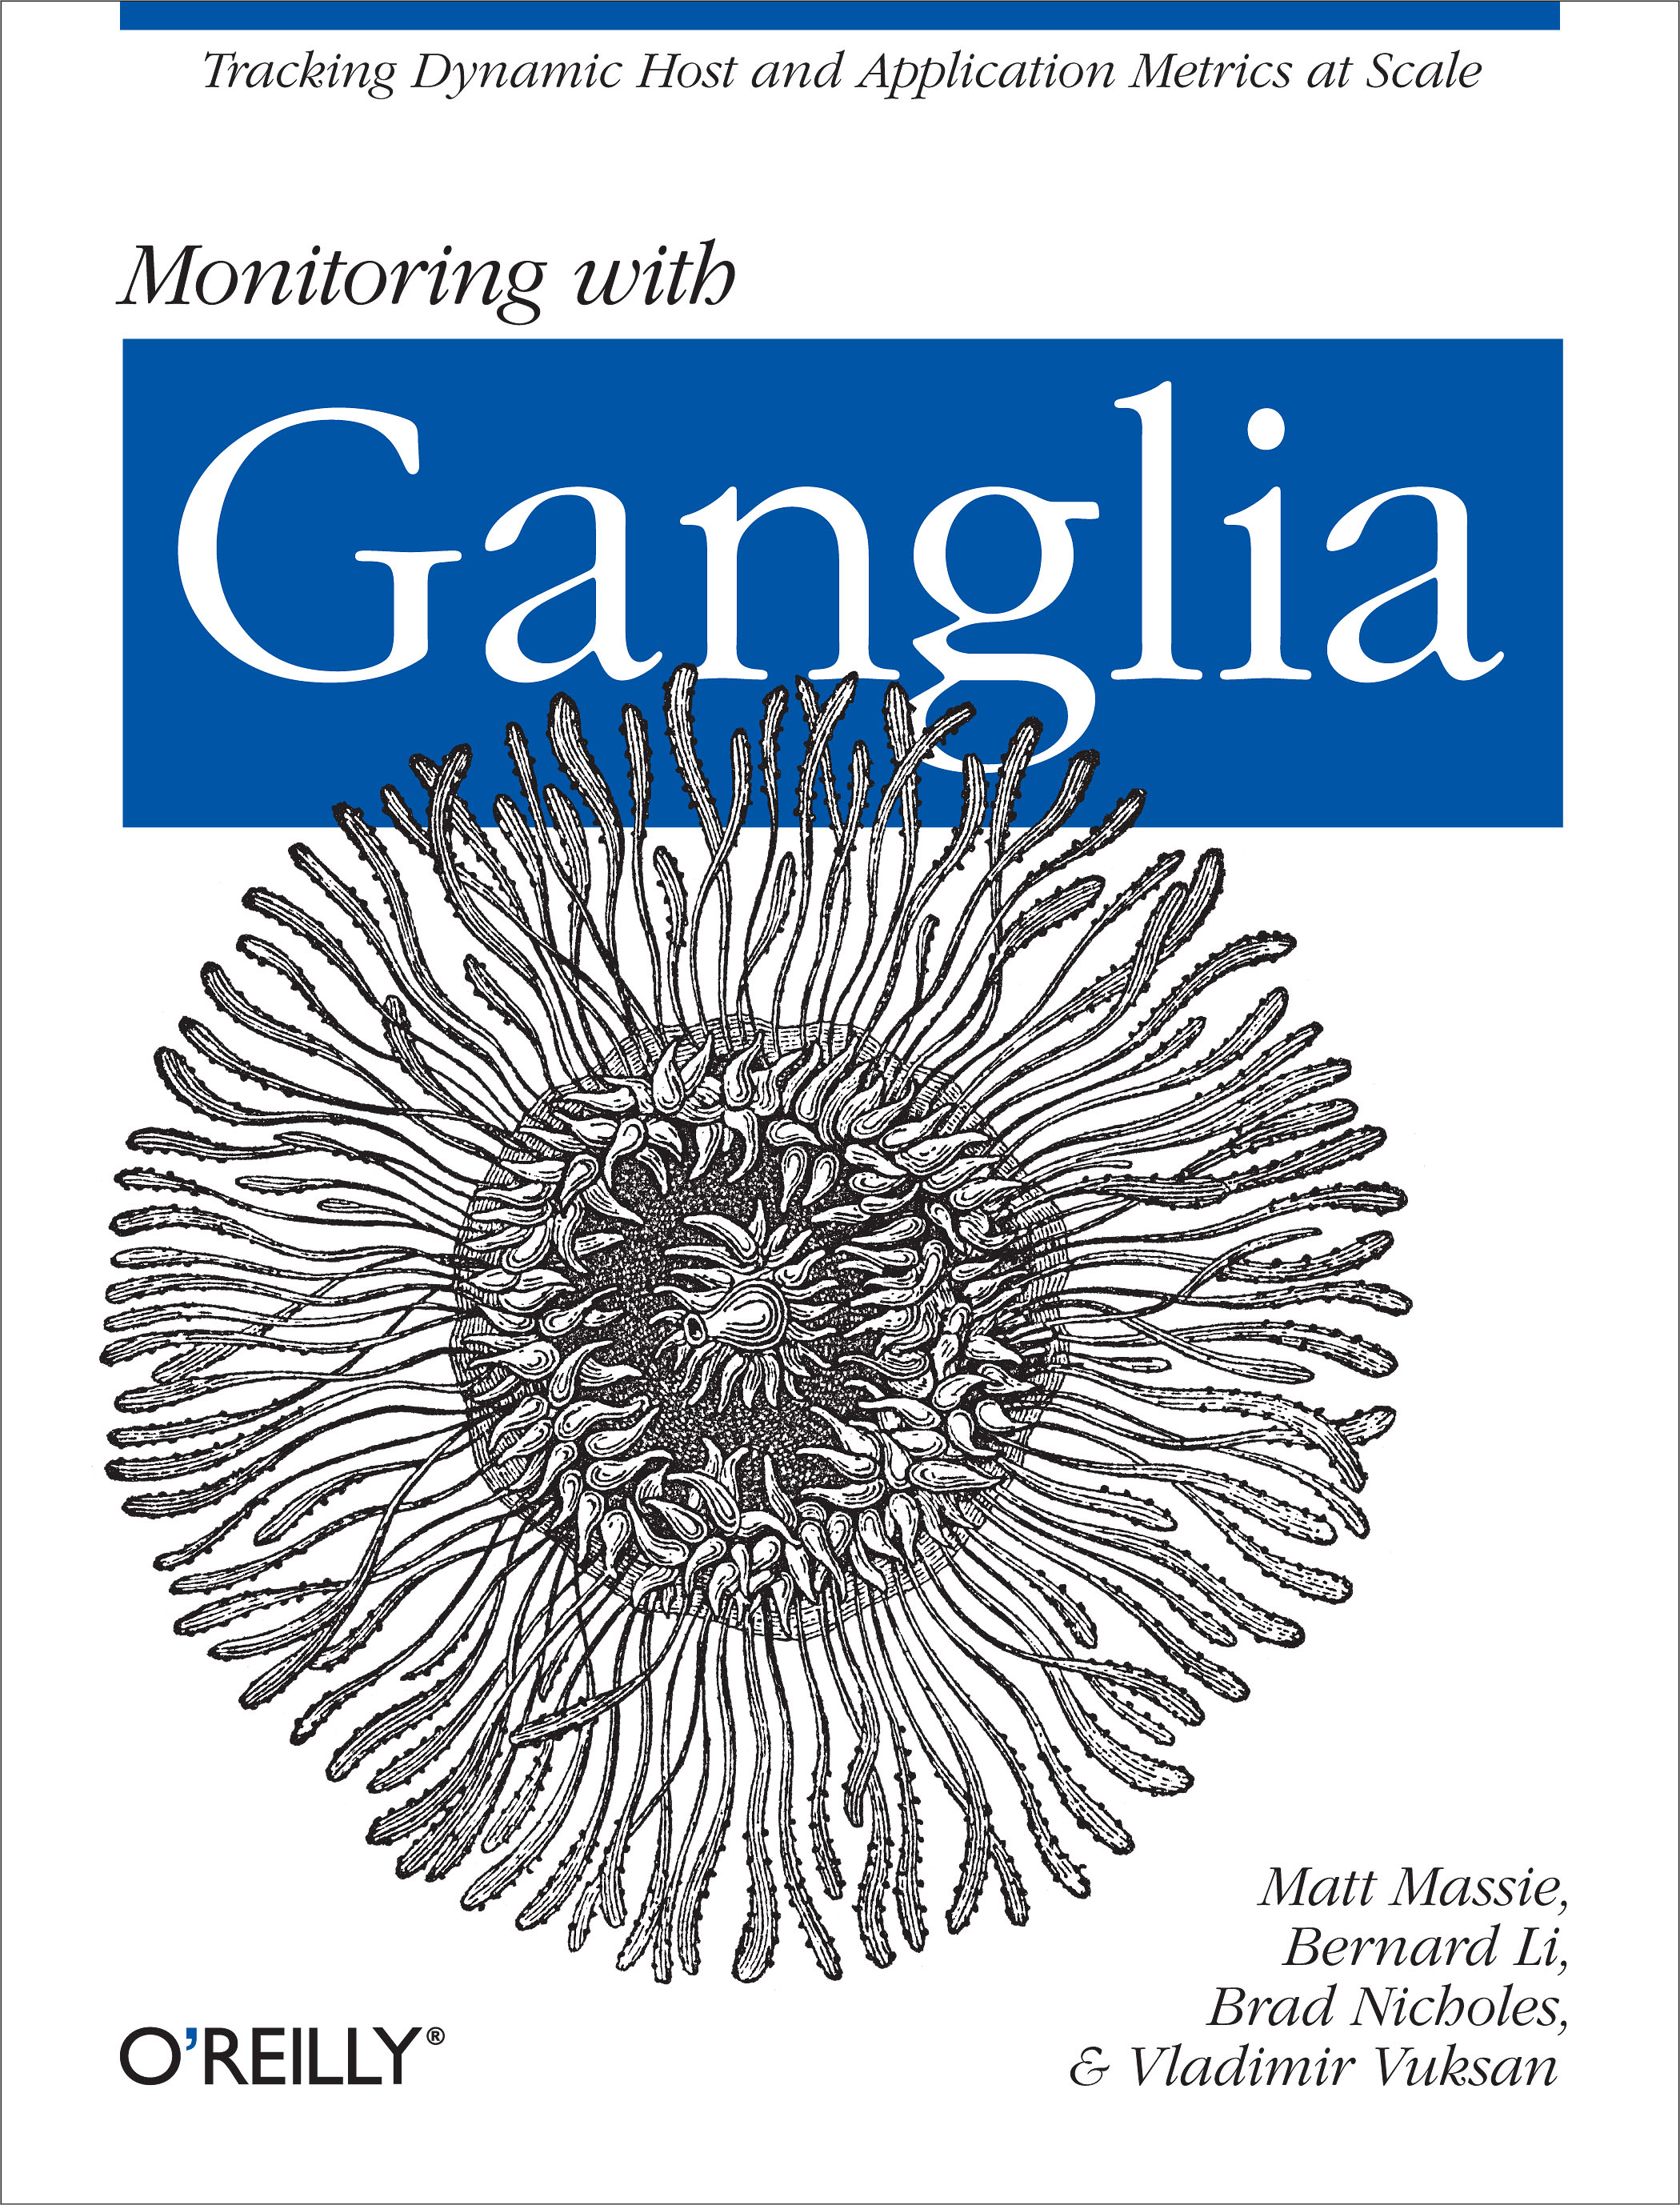
Monitoring with Ganglia
by Matt Massie
2020-08-26 16:58:32
Written by Ganglia designers and maintainers, this book shows you how to collect and visualize metrics from clusters, grids, and cloud infrastructures at any scale. Want to track CPU utilization from 50,000 hosts every ten seconds? Ganglia is just th...
Read more
Written by Ganglia designers and maintainers, this book shows you how to collect and visualize metrics from clusters, grids, and cloud infrastructures at any scale. Want to track CPU utilization from 50,000 hosts every ten seconds? Ganglia is just the tool you need, once you know how its main components work together. This hands-on book helps experienced system administrators take advantage of Ganglia 3.x. Learn how to extend the base set of metrics you collect, fetch current values, see aggregate views of metrics, and observe time-series trends in your data. Youâll also examine real-world case studies of Ganglia installs that feature challenging monitoring requirements. Determine whether Ganglia is a good fit for your environment Learn how Gangliaâs gmond and gmetad daemons build a metric collection overlay Plan for scalability early in your Ganglia deployment, with valuable tips and advice Take data visualization to a new level with gweb, Gangliaâs web frontend Write plugins to extend gmondâs metric-collection capability Troubleshoot issues you may encounter with a Ganglia installation Integrate Ganglia with the sFlow and Nagios monitoring systems Contributors include: Robert Alexander, Jeff Buchbinder, Frederiko Costa, Alex Dean, Dave Josephsen, Peter Phaal, and Daniel Pocock. Case study writers include: John Allspaw, Ramon Bastiaans, Adam Compton, Andrew Dibble, and Jonah Horowitz.
Less


